DriverDBv4: A database for human cancer driver gene research
FAQ 1: What is different from DriverDBv4 to v3?
Introducing DriverDBv4, our latest version that brings substantial enhancements to address the evolving landscape of cancer biology research.
With an expanded patient sample size, improved integration of multiple omics data, and innovative high-content visualizations, we empower researchers to gain deeper insights into the complex relationships within cancer between various omics.
This update includes five major improvements:
- Expanded datasets: The number of cohorts has increased from 33 to 93, resulting in a substantial rise in the sample size from approximately 12,000 to approximately 24,000.
- Incorporation of proteome data: In addition to the existing omics data, the proteome data has been included, expanding the scope of analysis within the database.
- Multi-omics integration: Eight published multi-omics tools utilizing matrix operations or dimension reduction methods have been incorporated. These tools enable the identification of multi-omics drivers in cancer by integrating heterogeneous data sources.
- New visualizations:
- For original sections: Revamped figures for existing sections to accommodate the expanded datasets, such as the Mutation section in GENE.
- For new sections: Introduction of novel visualizations to summarize high-content information and provide concise multi-omics results.
- Two new functions in Customized Analysis:
- Multi-omics driver: This function facilitates the identification of multi-omics drivers associated with user-defined groups of patients.
- Subgroup expression: This function visualizes gene expression patterns concerning specific clinical factors.
- For original sections: Revamped figures for existing sections to accommodate the expanded datasets, such as the Mutation section in GENE.
- For new sections: Introduction of novel visualizations to summarize high-content information and provide concise multi-omics results.
- Multi-omics driver: This function facilitates the identification of multi-omics drivers associated with user-defined groups of patients.
- Subgroup expression: This function visualizes gene expression patterns concerning specific clinical factors.
FAQ 2: How to perform and interpret networks in DriverDBv4?
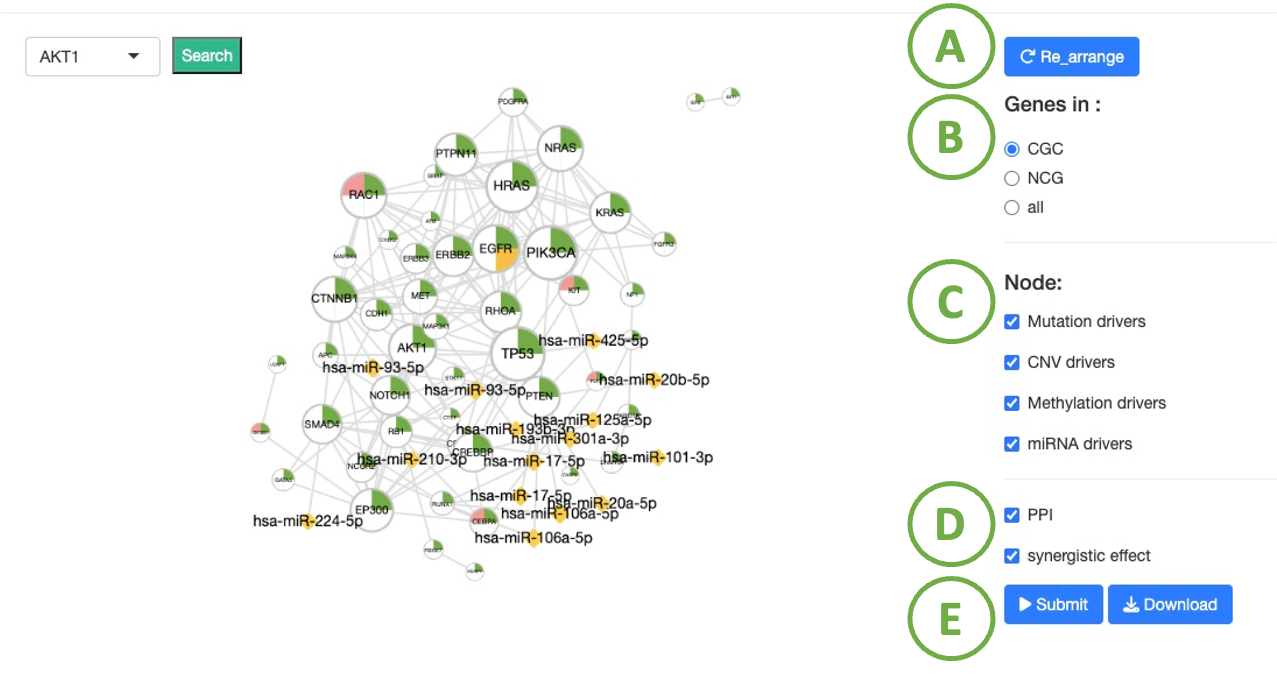
Cancer summary network
- To reset the arrangement to the original state.
- Toggle CGC/ NCG6.0 /all for selecting dataset.
- To select the driver genes that are related to different functions. For example, if you want to view the driver genes which are associated with DNA methylation in the cancer that you selected in previous page, you can toggle ‘Methylation drivers’.
- By selecting ‘PPI’, you can see the protein-protein interactions; By selecting ‘synergistic effect’, you can see the synergistic effect between driver genes and miRNA. These interactions are shown in the grey line between nodes.
- After setting the conditions, click ‘Submit’ button.
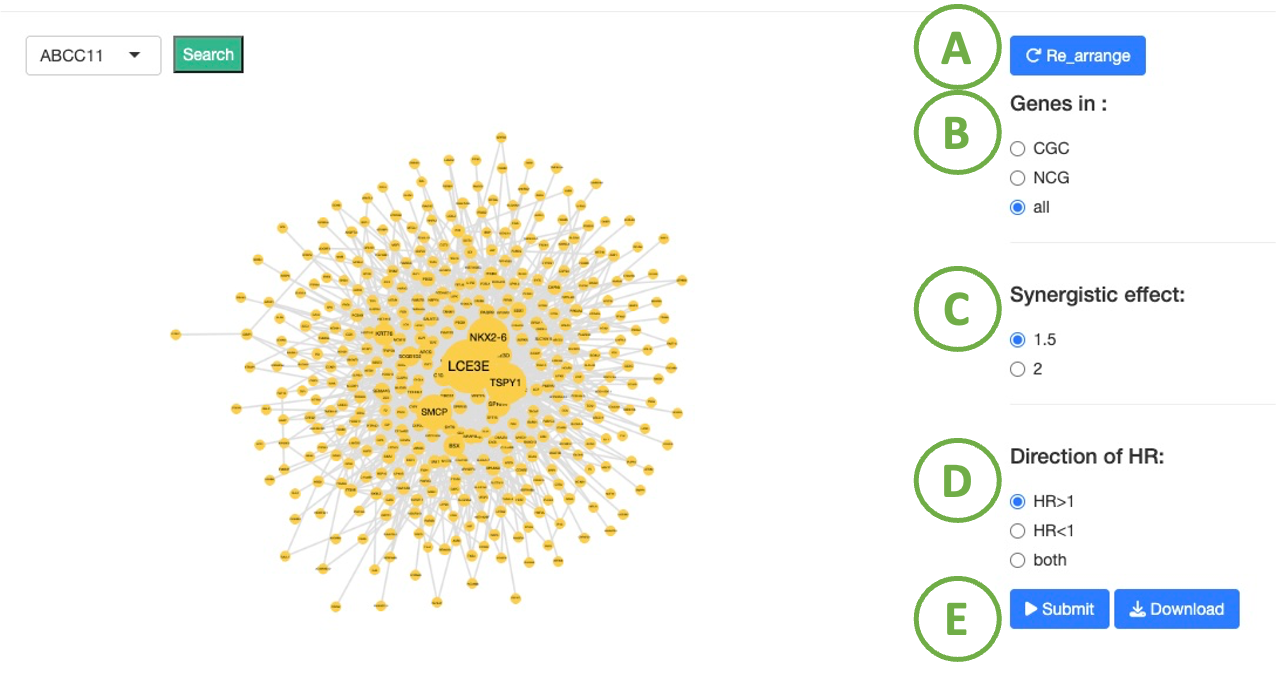
Cancer/Gene survival network
- To reset the arrangement to the original state.
- Toggle CGC/ NCG6.0 /all for selecting dataset.
- To select the difference fold of hazard ratio between two genes and single gene.
- To select the direction of hazard ratio which indicates the high or low expression group of the target genes result in poor survival.
- After setting the conditions, click ‘Submit’ button.
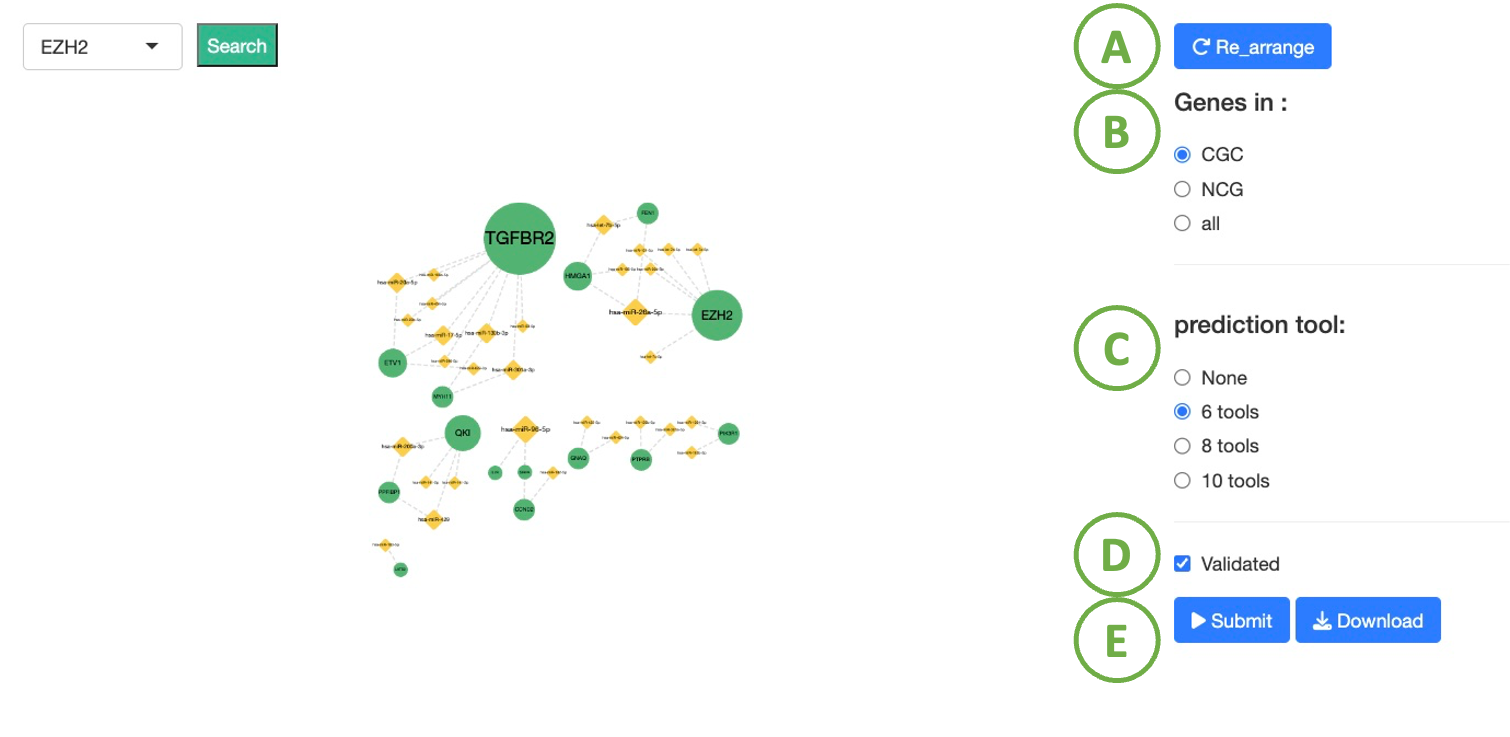
Cancer/Gene miRNA network
- To reset the arrangement to the original state.
- Toggle CGC/ NCG6.0 /all for selecting dataset.
- To select number of prediction tools, which shown by the dash line in the edge of the network.
- To select validated interactions between miRNA and gene or not, which shown by the solid line in the edge of the network.
- After setting the conditions, click ‘Submit’ button.
FAQ 3: How to manipulate (download/select/zoom) interactive figures in DriverDBv4?
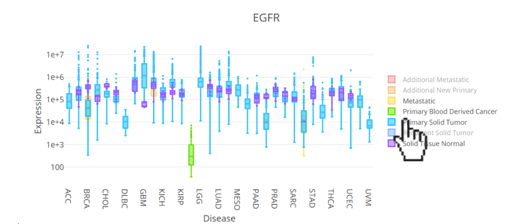
Select specific sample types:
By clicking the sample types of the legend, the specific sample types will be hid. By clicking the sample types again, the selected sample types will be shown on the plot.
Manipulate your figure:
As the mouse hovers over the interactive figure, the toolbar appears at the top of each figure.
- Download figure. Press to download the figure as a png.
- Zoom. Press to circle the area that you want to zoom in.
- Zoom in. Press to zoom in the figure.
- Zoom out. Press to zoom out the figure.
- Reset axes. Press to back to the original setting of the figure.

FAQ 4: What kind of computational algorithms/tools are used in DriverDBv4?
Mutation
ActiveDriver
Reimand J, Bader GD. Systematic analysis of somatic mutations in phosphorylation signaling predicts novel cancer drivers. Mol Syst Biol. 2013;9:637.
Dendrix
Vandin F, Upfal E, Raphael BJ. De novo discovery of mutated driver pathways in cancer. Genome Res. 2012 Feb;22(2):375-85.
OncodriveFM
Gonzalez-Perez A and Lopez-Bigas N. 2012. Functional impact bias reveals cancer drivers. Nucleic Acids Res., 10.1093/nar/gks743.
MutSig2CV
Lawrence MS et al. Mutational heterogeneity in cancer and the search for new cancer-associated genes. Nature. 2013 Jul 11;499(7457):214-218.
e-Driver
Porta-Pardo E, Godzik A. e-Driver: a novel method to identify protein regions driving cancer. Bioinformatics. 2014 Nov 1;30(21):3109-14.
MSEA
Jia P, Wang Q, Chen Q, Hutchinson KE, Pao W, Zhao Z. MSEA: detection and quantification of mutation hotspots through mutation set enrichment analysis. Genome Biol. 2014;15(10):489.
OncodriveCLUST
Tamborero D, Gonzalez-Perez A, Lopez-Bigas N. OncodriveCLUST: exploiting the positional clustering of somatic mutations to identify cancer genes. Bioinformatics. 2013 Sep 15;29(18):2238-44.
MUTEX
Babur, Özgün, et al. Systematic identification of cancer driving signaling pathways based on mutual exclusivity of genomic alterations. Genome biology 16.1 (2015): 45.
DriverML
Han Y et al. DriverML: a machine learning algorithm for identifying driver genes in cancer sequencing studies. Nucleic Acids Res. 2019 May 7;47(8):e45.
CNV
iGC
Lai, Y.P., Wang, L.B., Wang, W.A., Lai, L.C., Tsai, M.H., Lu, T.P. and Chuang, E.Y. (2017) iGC-an integrated analysis package of gene expression and copy number alteration. BMC Bioinformatics, 18, 35.
diggit
Alvarez, M.J., Chen, J.C. and Califano, A. (2015) DIGGIT: a Bioconductor package to infer genetic variants driving cellular phenotypes. Bioinformatics, 31, 4032-4034.
Methylation
Methylmix
Cedoz, P.L., Prunello, M., Brennan, K. and Gevaert, O. (2018) MethylMix 2.0: an R package for identifying DNA methylation genes. Bioinformatics, 34, 3044-3046.
ELMER
Silva, T.C., Coetzee, S.G., Gull, N., Yao, L., Hazelett, D.J., Noushmehr, H., Lin, D.C. and Berman, B.P. (2019) ELMER v.2: an R/Bioconductor package to reconstruct gene regulatory networks from DNA methylation and transcriptome profiles. Bioinformatics, 35, 1974-1977.
Multi-omics Integration
MOFA
Argelaguet R, Velten B, Arnol D, et al. Multi-Omics Factor Analysis-a framework for unsupervised integration of multi-omics data sets. Mol Syst Biol. 2018;14(6):e8124. Published 2018 Jun 20. doi:10.15252/msb.20178124.
DIABLO
Singh A, Shannon CP, Gautier B, et al. DIABLO: an integrative approach for identifying key molecular drivers from multi-omics assays. Bioinformatics. 2019;35(17):3055-3062. doi:10.1093/bioinformatics/bty1054.
OPLSDA
Thévenot, E. A., Roux, A., Xu, Y., Ezan, E., & Junot, C. (2015). Analysis of the human adult urinary metabolome variations with age, body mass index, and gender by implementing a comprehensive workflow for univariate and OPLS statistical analyses. Journal of Proteome Research, 14(8), 3322–3335.
SGCCA
Tenenhaus A, Philippe C, Guillemot V, Le Cao KA, Grill J, Frouin V. Variable selection for generalized canonical correlation analysis. Biostatistics. 2014;15(3):569-583. doi:10.1093/biostatistics/kxu001.
DriverSubNet
Zhang D, Bin Y. DriverSubNet: A Novel Algorithm for Identifying Cancer Driver Genes by Subnetwork Enrichment Analysis. Front Genet. 2021;11:607798. Published 2021 Feb 19. doi:10.3389/fgene.2020.607798.
SDGCCA
Moon S, Hwang J, Lee H. SDGCCA: Supervised Deep Generalized Canonical Correlation Analysis for Multi-Omics Integration. J Comput Biol. 2022;29(8):892-907. doi:10.1089/cmb.2021.0598.
dawnrank
Hou JP, Ma J. DawnRank: discovering personalized driver genes in cancer. Genome Med. 2014 Jul 31;6(7):56.
drivernet
Bashashati A, Haffari G, Ding J, Ha G, Lui K, Rosner J, Huntsman DG, Caldas C, Aparicio SA, Shah SP. DriverNet: uncovering the impact of somatic driver mutations on transcriptional networks in cancer. Genome Biol. 2012 Dec 22;13(12):R124.
comet
Leiserson MD, Wu HT, Vandin F, Raphael BJ. CoMEt: a statistical approach to identify combinations of mutually exclusive alterations in cancer. Genome Biol. 2015 Aug 8;16:160.
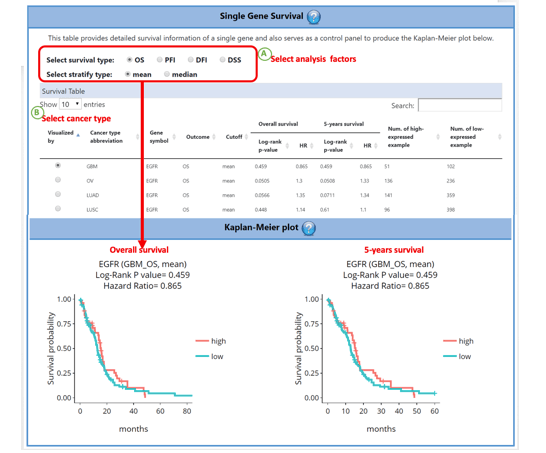
FAQ 5: How to visualize the Kaplan Meier plot of the specific gene/gene pair in ‘Survival’ function?
This table provides detailed survival information of a single gene in terms of hazard ratio (HR) and also serves as a control panel to produce the Kaplan-Meier plot for visualization. Select the desired cancer type on the table to generate a corresponding Kaplan-Meier plot below. Cancer types are abbreviated to OS (Overall survival), DFI (disease-free interval), PFI (progression-free interval), and DSS (disease-specific survival). The cut-off value can be either mean or median for analyses and plots.